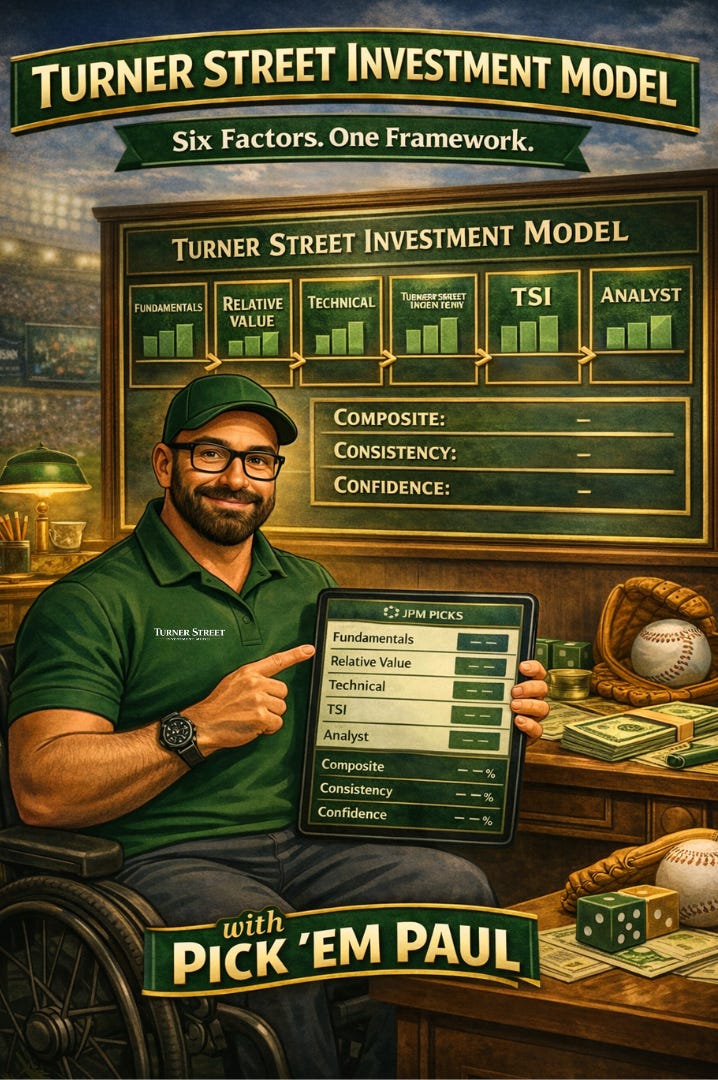
Meet the Turner Street Investment Model
Six Factors. One Framework.

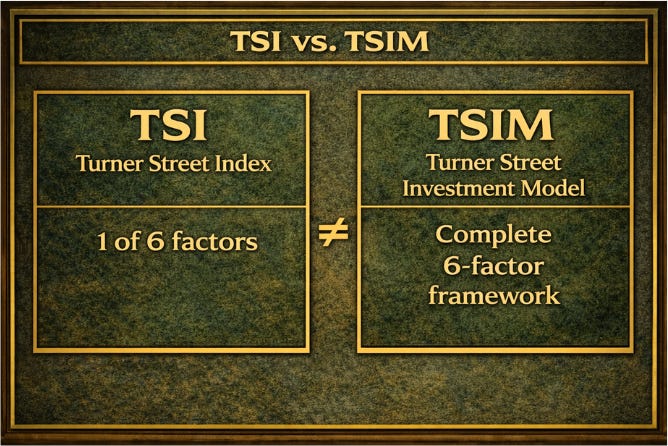
Editor’s Note: In last week’s SNAP blog, I referred to the full multi-factor model as the Turner Street Index (TSI). That was incorrect. The TSI is actually just one component of the larger Turner Street Investment Model (TSIM), specifically the options sentiment piece. This post introduces the TSIM properly. I apologize for the confusion and appreciate your patience as I build this thing in public.
Let me start with a confession.
Last week I wrote about SNAP and introduced a model I called the Turner Street Index. I used that name like I understood exactly what it was. I didn’t. Not fully.
The Turner Street Index is actually just one piece of a larger framework. The full model has a different name: the Turner Street Investment Model, or TSIM. The TSI is a component inside of it, not the whole thing. Getting that wrong in a public post is exactly the kind of mistake I promised I’d own when I launched JPM Picks.
So. Let’s do this right.

How the TSIM Started
I’m not a quant. I’m not a fund manager. I’m a guy who got tired of making stock decisions based on vibes, hot takes, or whatever a internet influencer was excited about.
So, I started prompting ChatGPT with a simple idea: I want to build a comprehensive model that helps me formulate my own stock predictions. What I got back was a framework. What I’ve been doing since is trying to actually understand it, test it, and make it useful.
I’ll be honest with you: this model is still a work in progress. Version 1 is live. The weights that determine how much each factor influences the final score are still being refined. I don’t have it fully dialed in yet, and I’m not going to pretend otherwise.
What I do have is a repeatable structure. And repeatable beats random every time.
What the TSIM Actually Is
The Turner Street Investment Model is a six-factor equity evaluation framework. The whole point is to take a bunch of different ways of looking at a stock and blend them into one organized, consistent output.
Instead of asking “is this a good stock,” the TSIM asks six separate questions at once and scores each one. Then it blends those scores together to give you a cleaner picture than any single signal could.
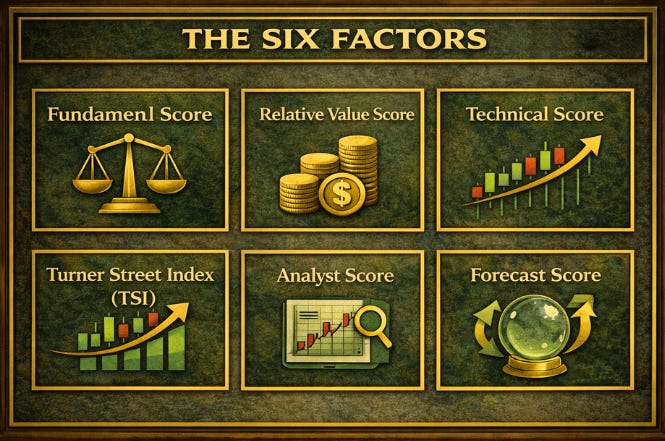
Here are the six pillars:
• Fundamentals: Is the company financially healthy and reasonably priced? This looks at things like how the stock is valued compared to its peers, earnings growth relative to price, and return on equity. The foundation of the whole model.
• Relative Value: Is this stock cheap or expensive compared to similar companies? Fundamentals looks at the company itself. Relative Value looks at the company in the context of its peers.
• Technical: What is the stock actually doing in the market? This pillar looks at price trends and momentum, using moving averages and other signals to understand whether the stock is in a healthy trend or a deteriorating one.
• Turner Street Index (TSI) / Market Implied: What is the options market signaling? This is where the TSI name actually lives. It captures sentiment from the options market, things like implied volatility and put/call ratios, as a temperature check on how the market is positioned.
• Analyst: Where do outside analysts think this stock is headed? This takes the gap between analyst price targets and the current price and normalizes it into a score. If analysts I follow aren’t covering the stock, this pillar remains blank.
• Forecast: What does a probability-weighted scenario analysis say? This builds a bull case, a base case, and a bear case, assigns probabilities to each, and calculates an expected value. It’s the model asking: if you run the full range of outcomes, where does this land?
Each pillar gets scored on a zero to ten scale. Higher is better. The model then blends all six scores together, with some pillars weighted more heavily than others based on how much I trust them to predict forward performance. The exact weights are still being refined in V1, so I’m going to describe the philosophy rather than quote specific percentages: the model leans most heavily on fundamentals as the anchor, with technical signals as the second major driver, and the remaining four pillars contributing as supporting layers.
What the Model Actually Spits Out
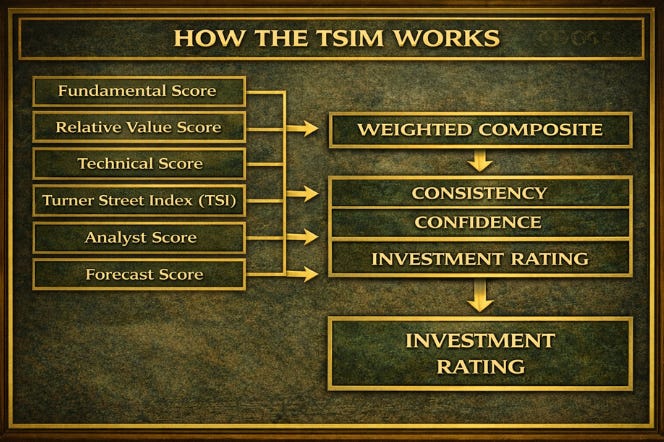
Once the six pillars are scored and blended, the TSIM produces three summary numbers:
• Composite Score (0-10): The weighted average of all six pillars. This is the single number that represents the model’s overall view of the stock. Think of it as the headline grade.
• Consistency Score (0-10): This measures how much the six pillars agree with each other. High consistency means the model is telling one coherent story. Low consistency means the signals are conflicting, and I should probably dig deeper before acting on the number.
• Confidence Score (0-100%): This blends expected upside, the composite score, and the consistency score into a single conviction number. It’s the model asking: how much should I trust this setup? The higher the confidence score, the more willing I am to size a position meaningfully.
From there, the model produces a rating and a target price. The rating bands work like this: a composite score in the low range is a Sell or Avoid, the middle range is a Hold or Watch, and the high range is a Buy or Strong Buy. The target price is a 12-month fair value estimate based on what the model’s inputs imply about where the stock should trade.
Position Sizing (The Part I Actually Care About)
The model isn’t just for picking stocks. It’s for sizing positions.
A Sell or Avoid rating means zero allocation. A Hold rating caps out at a small position. A Buy or Strong Buy opens a larger allocation, scaled by the confidence score and the implied upside. The idea is that your highest-conviction plays should get the most capital, and your low-conviction holds should stay small.
If that sounds familiar, it’s the same logic I apply to sports betting. You don’t flat-bet every game at the same size regardless of how strong the spot is. You size based on conviction. The TSIM is just that principle applied to equities.
Why I Built It in the First Place
Because I needed a process.
Before the TSIM, my stock evaluations were a mess of instincts, half-remembered earnings calls, and whatever narrative was loudest in my feed that week. That’s not analysis. That’s noise with a trading account attached.
The TSIM forces me to slow down and answer the same questions the same way every time. Is the company healthy? Is it cheap relative to peers? What is the chart doing? What is the options market saying? What do analysts think? What do the scenarios imply? Six questions. Consistent answers. One output.
It’s not a crystal ball. I want to be very clear about that. The TSIM identifies relative opportunities. It does not guarantee price paths. The SNAP situation I described last week is a good example: my original target was based on stale data. The model was right to have a bullish lean on SNAP. The specific number was wrong because I hadn’t updated the inputs after earnings. That’s a user error, not a model error. And it’s exactly the kind of mistake a process is designed to catch.
What’s Next
Now that you understand the structure, the next post is going to walk through a live example. We’ll take a real stock, run it through the six pillars, and show you what the output actually looks like in practice.
I’ll also keep updating you as V1 matures. When the weights get finalized, I’ll tell you. When the model gets something wrong, I’ll tell you that too. Building this in public means the wins and the losses both go on the record.
That’s the whole deal with JPM Picks. Process over predictions. Transparency over polish. And never pretending I have a crystal ball when all I really have is framework and a willingness to do the work.

JPM Picks is for entertainment and educational purposes only. Not financial advice. Not gambling advice. The Turner Street Investment Model is an educational framework. Scores reflect relative rankings, not guarantees of future prices. Always do your own homework and never risk money you can’t afford to lose.